Showing posts with label affordability. Show all posts

Monday, June 24, 2013

The 2013 Guidelines in Context

With one quick vote, the 2013 New York City Rent Guidelines Board process came to a close Thursday night, with the board approving apartment increases of 4% for one year leases and 7.75% for two year leases, with a rent freeze imposed for Single Room Occupancy apartments.

For those of tenants who have engaged with the process for the past third of a year, it was a startling end and a disappointing result.

In the media narrative and in the popular imagination, the RGB’s final vote is a raucous and chaotic battle between ever-warring constituencies, representing contentious democracy at its best or worst (depending on the perspective). This is a myth. The vote is shockingly dull, and executed with an efficiency born of repetition.

The scene Thursday was ritualistic: the tenant members proposed a low increase; the owner members proposed a high increase; the public members voted unanimously in between the two, appearing as magnanimously Solomonic in the process. The press played its part, reporting equally on the tenants’ and landlord’s frustrations with the result. When the vote was over, landlord representatives spoke to reporters, lit cigars, and posed for pictures with Jimmy McMillan.

The result of this process, however, in anything but dull- it is a recurring regressive redistribution of wealth from tenants to landlords. This year’s increase will be particularly painful. At 4% and 7.75%, the rent hike is not only the largest since before the recession, as reported in the press, but is also higher than the average increase under RGB Chair Jonathan Kimmel (3% and 5.88%, including the 2013 guidelines), higher than the average increase for the much-maligned former Board chair Marvin Markus (3.44% and 6.38%), and in fact higher than the average RGB increase for the board’s entire history (3.3% and 5.84%).

If there is any silver lining to the vote, it is that the Board rejected landlords’ calls for a “supplemental” or “minimum dollar” increase, which would have disproportionately stressed the budgets of low income and senior tenants. Tenant advocates wonder, however, if they are being forced into a pattern of relatively low increases with pro-landlord provisos (like the 2012 vote) followed by high increases without them (as we saw this year).

The board also chose to freeze rents completely for SROs, dispensing with the usual provision that the rent freeze applies only to buildings with a certain percentage of occupied SRO units. This is a victory for SRO tenants and their advocates, and it should be celebrated.

The SRO rent freeze should not, however, overshadow the impact the Board’s apartment increases will have on an estimated 2.5 million tenants throughout the city. In addition to being a mid-recession transfer of income from renters to property owners, this rent increase will be another constraining factor on New Yorkers’ ability to make ends meet. It will force many to chose between rent and other necessities of life, not to mention the less vital aspects of commerce that keep the city running. It is certainly no stimulus to our depressive economy.

The high increase will also encourage many tenants to sign one year leases, rather than two. Even though a two year lease presents tenants with a slight (.25%) benefit over a one year lease, many low income tenants will not be able to shoulder the up-front costs of a 7.75% increase. This adds an additional layer of regression to the 2013 guidelines, as those most equipped to save with a two year increase are those most able to pay higher up-front costs- i.e. higher income or higher net-wealth households.

Finally, this increase cements the Board’s image as a guarantor of landlord profits. Whether by inertia or design, the Board has repeatedly chosen to increase rents to cover for any perceived fluctuations in the cost of running a rent stabilized apartment. This should not be a forgone conclusion; given that landlords have many ways of making profit off their buildings- everything from commercial rents to cell phone towers to the dreaded Major Capital Improvement- there is no need to continuously fall back on renewal lease rent increases to recoup landlords for any change in costs. The board must also rethink the way it calculates these costs, as numerous reports have shown that the Price Index of Operating Costs- the board’s main tool for estimating prices for goods purchased by landlords- seems to overstate real expenses. Whether that is because landlords find a way to economize their purchases or because the prices are overstated, we do not know. All we know is that the price data overshoots the expense data, and is leading Board members to vote for inflated guidelines.

Next year will bring in a new Mayoral administration, and with it a new Rent Guidelines Board. Fixing this broken institution should be a major priority for the next Mayor, both in terms of making responsible appointments and rethinking the Prince Index of Operating Costs. The Mayor should also call on the next Board Chair to hold more public hearings at times and places convenient to the majority of rent stabilized tenants, and present a full accounting of the Board’s decision to the City Council and the public at large. While it is the State Legislature that has the power to rewrite the rules regarding the RGB, it is in the Mayor’s power to change the culture of the Board. Elected officials have spoken out against these increases, and called for Board to change its ways (see examples here, here, and here). Tenants have made their voices heard throughout this process, whether at the People’s RGB, the formal public hearing, or the vote itself. We all know this system flawed; the process must be reconsidered before the board meets again in 2014.

Thursday, June 20, 2013

Final Vote: Tonight, 5:30

After four months of presentations, analysis, testimonies, and hearings (formal and otherwise), the Rent Guidelines Board will vote tonight on a rent adjustment for over one million stabilized apartments and SROs. We hope they have listened to the many tenants who testified that the RGB's proposed rent increases are simply too high. We hope they remember the invited guests who testified that New York is facing a severe affordability crises. We hope they recall the analysis presented on this blog, arguing that the Board's own data supports the case against another high rent increase.

We hope we have cogently and persuasively made the case that tenants cannot afford the kinds of rent increases proposed by this Board, and that the hikes demanded by owner advocates are unwarranted. Countless households throughout the city are already forced to choose between basic necessities- such as food and medicine- and making the rent. These increases could push many over the edge, and into chaos. At the same time, property ownership in New York City continues to be an extremely profitable enterprise, despite the endless protestations of the landlord lobby.

For all these reasons, and for the reasons elaborated on this blog many times before, we urge the board to reject the proposed increases.

The final vote of the New York City RGB will be held tonight at 5:30 PM in the Great Hall at Cooper Union, located at 7 East 7th Street. We urge tenants to be there, bear witness, and speak to reporters after the vote about how the final guideline will affect you.

Tuesday, June 18, 2013

Testimony: Nicole Zinardi

The following testimony was submitted by Nicole Zinardi, Tenant Organizer at Tenants & Neighbors, who has been working in rent stabilized buildings across Brooklyn, Queens, Manhattan and the Bronx:
My name is Nicole and I am a tenant organizer at Tenants & Neighbors. I work almost exclusively in Rent Stabilized buildings. I work with tenants in buildings in Inwood, Manhattan, various areas in the Bronx including Parkchester, Pelham Bay, Norwood, and Fordham Heights, as well as in Flatbush, Brooklyn, and Jamaica, Queens. The buildings I work in vary greatly in terms of size and tenant demographics. Some are small, while the largest building I work with has 169 apartments. Most tenants at 2425 Nostrand Avenue in Flatbush are from Trinidad or Jamaica. The majority of tenants in my buildings in Harlem and Fordham Heights are African American, while 9016 171st in Jamaica is home to a mix of Hispanic, Indian, and African American residents. In Manhattan, most tenants I work with are from Eastern Europe, Puerto Rico, and states across the U.S. I work with tenants who are community organizers, musicians, researchers, receptionists, and dentists. I work with tenants who are unemployed, retired, and in school. Most are low to moderate income adults who work long hours to make enough money to support their family in New York City.

Despite differences in location, size, and tenant demographics, all these buildings share distinct troubling characteristics that render any major rent increase unwarranted, especially the increases proposed by the Rent Guidelines Board last month. The poor management, bad conditions, and rent overcharges currently festering in hundreds of buildings in the city contribute to the decline of the well-being of people and the buildings they live in as well as community vitality and cohesion. I have seen the situation expanded and prolonged by these shortcomings: tenants are forced to live with degrading physical conditions as well as the tormenting mental condition brought on by landlord harassment and illegal overcharges. Failures of landlords cannot be justified to continue through an inflated award of profit to landlord corporations.

 Tenants across the city suffer from poor building management. Buildings are managed with blatant incompetence and neglect of tenants‘ rights and needs. Conditions continually deteriorate because of under-qualified staff, and there is a lack of comprehensive communication systems between tenants and the landlord. At 3224 Grand Concourse in the Bronx, there is one superintendent for all 8 buildings. He is not qualified or certified to make the electrical and plumbing repairs he is responsible for, and there is no system for inspection or repair appointments. Tenants have had ongoing plumbing and electrical issues that have been ignored and, if fixed, not fixed sufficiently. Tenants are forced to use their own money to find other means of repair. In addition, tenants have no straightforward means of contacting their management or relaying their concerns and requests. There is no on-site management besides the super, and the management is unresponsive to phone calls.

Another aspect of poor management is lack of organization in regards to leases and rent. At 3224 Grand Concourse, tenants do not receive rent slips, and many tenants have their rent rejected for no given reason. In addition, a lot of tenants wait months to get a new lease after their last one expires. Clearly, this opens the door for confusion and rent overcharges. Management systems like this create uncertainty and frustration for tenants. It is not acceptable that tenants are upholding their end of their lease while landlords ignore their responsibility to provide management that correctly and effectively provides required services and operates a transparent system of communication and rent payment.

The conditions at 9016 171st in Jamaica, Queens highlight the horrible conditions I have seen in buildings across New York. Landlords try to save money and time by ignoring services, repairs, and maintenance. At 9016 171st Street, there are 271 HPD violations registered on this 23 unit building, 217 of which are classified as hazardous. The building has not had gas since April 3rd, which means tenants are not able to cook in their apartments; they are forced to spend money to buy meals for their families. In addition, tenants suffer from leaks and the nuisance of mice and rodents. Tenants also claim that the electricity is turned off at random times, and, like almost every single one of my other rent stabilized buildings, the heat and hot water are grossly inconsistent during the winter months, as the landlord tries to save money by keeping the temperature at well below the legal levels, especially at night and in the early morning. In addition, the landlord owes the Department of Buildings $2,500 for failure to comply with the mandated boiler conditions. The boiler is too small to provide adequate heat to all units in the building, and half of the building consistently has no hot water. Any landlord that is letting conditions deteriorate to this extent in a building does not deserve the proposed rent increase. Landlords must be held accountable and demonstrate that they are using tenants’ rent to keep the building in a legal and acceptable condition for families to live. If they are not using rent to provide required services and maintenance, it is not acceptable that those rents are raised. In addition, because of these horrible conditions, tenants are forced to use their own money for things such as space heaters, take-out meals, and the hiring of exterminators and plumbers, and they cannot afford to pay higher rents while simultaneously funding repairs and supplemental purchases made necessary by the landlord.

As you know, the system of rent stabilization creates huge incentives for landlords to raise rent in an apartment above $2500. Illegally overcharging tenants in rent works two-fold for landlords: in addition to bringing the rent closer to the $2500 mark, they force many lower income tenants out of their apartment who cannot afford the higher rent, thus gaining a further increase through the vacancy bonus, in turn bringing the rent on the unit even closer to the market rate threshold. I have seen evidence of rent overcharge in a number of the buildings I work with. Tenants are charged illegally inflated appliance surcharge fees and construction costs are exaggerated so the landlord can tack on huge IAIs to the rent. Tenants at 2425 Nostrand Avenue in Brooklyn are charged over $20 each month for an appliance surcharge, which in their case refers to the A/C unit in their apartment, the fee for which should legally be around $5. And, one tenant at 854 West 180th Street moved into an apartment with a rent of $2150. In addition to the apartment being illegally listed as market rate on the lease, the rent was a huge increase from the previous tenant’s rent of $1477.17, and there was no explanation for the increase. While there was construction done on the unit in between tenants, the landlord would have had to spend at least $41,000 on construction in order to legally raise the rent by the amount it was raised. Now, the tenant must go through the lengthy and burdensome process of applying for a rent overcharge through HCR, which may or may not deliver any results. It is unacceptable to grant landlords the proposed rent increases while they are currently collecting illegal amounts of rent. Rent increase decisions should be based on a determination of how completely legal rents are allowing landlords to fulfill their obligations to rent stabilized tenants, this determination is distorted when landlords charge illegal rents, and allowing an increase is not justified if landlords are already collecting more money than they are legally allowed.

Rent Stabilization exists in New York City for a reason-to keep acceptable and comfortable living affordable for the city’s people. Clearly, the system has a number of negative side-effects that inhibit the system’s intended goal, most prominently: poor management, bad conditions, and rent overcharges. Any one of these issues taken independently is enough justification to demand a more moderate rent increase than the one proposed. When all three of these issues clash and build upon one another, the proposed rent increase should be unthinkable.

And I can say this from first-hand experience. I have seen these buildings, I have been inside these apartments, and I have formed relationships with these rent stabilized tenants. I have experienced the worry, frustration, and exhaustion tenants struggle with on a daily basis.  Approving the rent increase will further break down the intended purpose of the rent stabilization system by allowing and strengthening these effects. To hand landlords an increase in profits under these circumstances is absurd. They first must be held accountable and prove they are capable of using their funds intended application: to foster affordability and livability for tenants in New York City.

Testimony: Michael Gillett

The following testimony was presented by Michael Gillett, a rent stabilized tenant in Sunset Park, Brooklyn who has faced repeated permanent and compound Major Capital Improvement rent increases, on top of the annual RGB adjustments:
Good afternoon Board Members and thank you for this opportunity.  My name is Michael and I'm a Rent Stabilized tenant in Sunset Park Brooklyn.  I've lived  in an 8-unit building since late 2006.  Since I've lived in this apartment, my rent has gone up over $500.  I've come here today because I'd like to express to you why it is that the magnitude of increase you've proposed for two-year leases is entirely too high and would be burdensome to me.

There are a broad range of Rent Stabilized tenants in this city.  Some have lived in their apartments for many years but a lot of us are young adults working 9-5 and have had virtually stagnant wages in this tough & persistently negative economy.  Personally, my Landlord has used at least 3 separate Major Capital Increases as a method to speed units within the building to the high-rent threshold which would remove them from rent protections.  I have been the only person to stand against them in the building.  One downstairs neighbor of mine was so intimidated and unnerved by the process that he moved his entire family out of the building when he deliberated the prospect of compounding rents + MCI charges in the years to come.  The Landlord wasted no time in getting the permits needed and then gut-renovating that apartment and charging the new tenants market rate rent.  There is also another apartment in the building with tenants paying market rent.  Considering the perpetual nature of MCI rent increases he will have permanent residual income aside from whatever increase you decide.  He also owns many buildings across Park Slope Brooklyn with tenants paying market rate rents.

Landlords have also been receiving substantial profits in recent years.  In my borough of Brooklyn, the Net Operating Income stands at approximately 33%.

I would like to board to know that if you go through with this increase, you will harm the diversity of this city.  I could not afford my apartment at market rate, and having to pay this extra money would be burdensome and could price a lot of people out of their apartments.  With this being said, I would like to strongly implore you to consider a 0% increase at this time.

Testimony: Margaret Coughlan

The following testimony was read by Margaret Coughlan, a tenant in Staten Island who, like many others, has an oppressive rent burden but is just barely disqualified for SCRIE:
My name is Margaret Coughlan. I have lived in the same rent-stabilized apartment in Staten Island for 30 years. Since I retired 4 years ago, any rent increase is of much greater concern to me than while I was working. 
I do not qualify for SCRIE.  My income is my pension and Social Security. After health insurance and taxes, my rent is 48% of my income. While I can manage, I realize that there are many New Yorkers with less income and higher rents. 
While any rent increase is of concern to me, I know that the same increase would be felt even more keenly by those less fortunate.
Thank you.

Monday, June 17, 2013

Comptroller: The Continued Decline in Affordable Housing

New York State Comptroller Tom DiNapoli has released a timely report decrying "the continued decline of affordable housing in New York City." The study details the bind facing low income New Yorkers, who must put more than half their income towards rent as a condition of staying in the city. The Comptroller writes, 
The housing burden is heaviest for low-income households. One-fifth of New York City’s households had incomes of $15,000 or less in 2011. Nearly 80 percent of these households devoted more than half of their incomes to rent, a higher share than any other income group. Even after government subsidies are factored in, more than half (56 percent) of these households had a severe housing burden, a much higher share than any other income group (see Figure 4). For households with incomes of $15,000 to $30,000, nearly 40 percent devoted more than half of their incomes to rent in 2011. 
The report also details the wide-spread deregulation of the rent stabilized housing stock. Last year, the city lost nearly 9,500 rent stabilized apartments. This report puts that figure into historical context, showing that "the share of rental units subject to some form of rent regulation fell from 74 percent in 1991 to 61 percent in 2011." While other factors are also to blame, persistent compound Rent Guidelines Board increases are certainly a major factor in this rampant deregulation.

This is the context in which the RGB makes its decision: New Yorkers are facing historically high rent burdens, and the number of rent stabilized apartments left in the city is fading fast. 

The Rent Guidelines Board has just one job: to decide the rent adjustment for renewal leases on regulated apartments in a given year. Put that way, their mission seems narrow and perhaps obscure. But, as this timely report shows, their actions have significant impacts on millions of tenants trying to keep up with the rent in a challenging housing market.

Testimony: Sam Stein, Tenants & Neighbors

On Thursday, June 13th, over 100 tenants testified against the Rent Guidelines Board's unusually high preliminary guidelines (3.25% - 6.25% for one year leases, and 5% - 9.5% for two year leases), as well as their decision to jettison an outer borough hearing. We heard from apartment tenants and SRO tenants, long term residents and relative newcomers, young and old, representing diverse communities of regulated tenants from around the city. Across these differences, there was a unified message: the RGB's proposed increases are way too high. In today's economy, tenants simply cannot afford them. The board must reconsider, and reject these unwarranted increases.

We will be posting the testimonies of a few tenants who spoke out that day, starting with Tenants & Neighbors' Rent Regulation Campaign Coordinator (and rent stabilized tenant) Sam Stein. Want to share your testimony with us? Please email a copy to sstein@tandn.org.
Good morning. Thank you to Chairman Kimmel for holding this hearing today, and to all of you for hearing the testimony of rent stabilized tenants about the proposed guidelines for renewal lease increases. My name is Sam Stein, and I am an organizer at New York State Tenants & Neighbors, a grassroots organization that helps renters preserve at-risk affordable housing and strengthen tenants’ rights in New York. We represent approximately 2500 tenants, most of whom are rent stabilized, almost all of whom have low or moderate incomes, and many of whom are elderly people on fixed incomes. I am also a tenant in a rent stabilized apartment in Queens. 
As a representative of my organization and our members, I have attended every public meeting that this board has held over the past 4 months, and read each report that the board staff has ably produced. Based on the information presented to the board by both staff and invited experts, as well as my experience counseling rent stabilized tenants from around the city, I believe the preliminary guidelines this board has approved are far too high. 
  • As the Income and Affordability report showed, tenants are facing dire economic conditions, with unemployment rising again, wages declining, and nearly a third of rent stabilized tenants city-wide putting half their income towards rent.  
  • As the Income and Expense study reported, landlord’s net operating incomes have risen for the 7th consecutive year. 
  • As the Mortgage Survey showed, the market for rent stabilized buildings remains strong, even in light of a national housing crisis. 
  • According the RGB’s “Changes” report, at least 9,499 apartments left rent stabilization last year. That is a staggering number: it’s more New Yorkers than complained about bed bugs at the peak of that crisis; it’s more New Yorkers than were killed by cigarettes last year; it’s more New Yorkers than are on the organ donor waiting lists. It’s an ongoing crisis in this city, and one that the RGB must take into account as it considers an abnormally high preliminary range of rent increases. 
I’d like to address the public members, because how you choose to vote is of the utmost importance. Mr. Kimmel, Ms. Levy-Odom, Ms. Moore, Ms. Shine, and Mr. Wenk: on April 30th, you voted for a preliminary guideline of 3.25% to 6.25% for one-year leases, and 5% to 9.5% for two-year leases. We believe this entire range is above the level many tenants can afford, and beyond the need of most landlords. Additionally, the proposed guidelines under consideration today would send many apartments over the vacancy decontrol threshold, setting them up to leave rent stabilization when the current tenant leaves. This would impact not just the rent stabilized tenants we and our allied organizations represent; it would also disrupt the stability and change the character of the these tenants' communities, and would have broader implications for our city as a whole. As you are representatives of the public- of the New Yorkers who care deeply about their neighbors and about the communities in which they live- I would like to ask you each, personally, to vote for a significantly lower adjustment this year than what was approved at the preliminary vote. Additionally, if a proviso targeting lower rent apartments is once again introduced this year, I ask you to reject it. As data from the Community Service Society has shown time and again, these provisos disproportionately fall on the backs of the poorest, oldest and most long-term of rent stabilized tenants. The tenants we represent, and many others, simply cannot afford these kinds of increases. 
We urge the board to consider holding rents still in 2013. If you determine that this is not possible, we encourage the board to consider the lowest possible rent increase, and ask you to remember the tenants who testify here today, and the hundreds of thousands more who this rent increase would affect.

Tuesday, June 11, 2013

Testify Thursday!

The RGB has heard from their staff about economic landscape facing tenants; they have heard from invited experts from both the landlord and tenant side; they have heard from government agencies that deal with housing. Now it's time for the RGB to hear from us.

Tenants have just one chance to speak out about the board's unusually high preliminary guidelines, and this is it: Thursday, June 13th, at 49-51 Chambers Street, starting at 10 am. Registration closes at 7 pm, but testimonies will be heard until everyone who has registered has a chance to speak. You can pre-register by calling the RGB at 212 385 2934, or you can register in person on Thursday. Tenants have 3 minutes to testify. Sometimes board members- either tenant members, owner members or public members- will ask follow up questions about your testimony. Don't be nervous- we are just telling our stories, and expressing the truth as we see it.

The Rent Guidelines Board needs to hear directly from tenants about the kinds of economic straights these proposed increase could put us in. They need to hear about the difficulties we face every day just to pay the rent, and the importance of long-term tenants to our neighborhoods and our city. They need to hear about the difficulty of finding suitable housing if we can't afford to stay in our rent stabilized apartments. And they need to hear about all the ways landlords manage raise rents, on top of the increases passed by the board. Please come and share your story with the Rent Guidelines Board. This is our one chance to formally speak out against these proposed guidelines, which would push too many of our homes beyond our budgets and towards deregulation.

To RSVP, or to request additional information about the hearing, please contact Sam Stein at sstein@tandn.org, or call 212 608 4320 x316. Tenants & Neighbors can help you prepare your testimony, or answer any questions you might have about the process. Tenants & Neighbors staff will be there in our white and blue t-shirts, so please look for us and come say hi when you arrive.

The RGB has proposed rent increases of 3.25% - 6.25% for one year leases, and 5% - 9.5% for two year leases. They have to hear from tenants that this is simply too high.


Thursday, May 30, 2013

Analysis: Housing Supply and Changes Reports

At their final public meeting this morning, the New York City Rent Guidelines Board released their last reports of the year: the 2013 Housing Supply Report, and Changes to the Rent Stabilized Housing Stock in New York City in 2012. These reports look at additions and subtractions to the universe of rent stabilized apartments, as well as patterns in new construction, renovation, conversion and other changes to the general New York City housing stock.

Lurking behind the figures in these reports is a quirk in the rent regulations. Since 1993, New York’s rent stabilization system has contained a poison pill- the Vacancy Decontrol system, whereby empty apartments that could rent for over $2,500 are brought out of the regulatory system and into the “free market”. This has given landlords a target to reach, creating an even greater incentive to exploit every loophole available in the system to raise rents. As a consequence, landlords will seek high turnover in their apartments, so that they can collect “vacancy bonuses” and Individual Apartment Improvements between tenancies. To extract higher rents from long term tenants, they rely on Major Capital Improvements and Rent Guidelines Board increases, and lobby for the highest imaginable increases annually. Eventually, their apartments hit the magic number of $2,500, and loose the price and eviction protections associated with rent stabilization.

In the face of deregulation- primarily through Vacancy Decontrol- New York City’s rent stabilized housing stock continues to decline much faster than it expands. According the RGB’s “Changes” report, at least 9,499 apartments left rent stabilization last year. (Most likely far more were taken out of rent stabilization, but this figure reflects the number of apartments that formally registered with HCR as deregulated.) That is a staggering number: it’s more New Yorkers than complained about bed bugs at the peak of their reign of terror; it’s more New Yorkers than were killed by cigarettes last year; it’s more New Yorkers than are on the organ donor waiting lists. It’s an ongoing crisis in this city, and one that the RGB must take into account as it considers an abnormally high preliminary range of rent increases.

The city did add some rent stabilized apartments to the housing stock, but many of them are far beyond the realm of affordability. A very large portion of new rent stabilized apartments come from tax abatement programs that mandate temporary rent stabilization. But in the case of 421-a, a tax credit that added 2,509 rent stabilized apartments to the stock, the average rents are $3,106. For that to be considered affordable by federal standards, residents would have to make $124,240; the average income for rent stabilized tenants, however, is less than one third of that figure- just $37,000. Much of the new rent stabilized housing, therefore, is not only temporary but out of reach for most prospective renters.

Perhaps as a consequence of the disappearance of affordable rent stabilized housing, and the paucity of vacant rent stabilized homes, rent stabilized apartments are also some of the most crowded. About 14% of rent stabilized housing is overcrowded; 5.6% is considered “severely” squished.

In the meantime, like oil in Texas, real estate in New York continues to thrive. After the downturn in construction in 2009, new permits have risen every year for the past three years, with permits for 10,344 apartments issued last year. The Bronx is especially booming, with a 128.7% rise in new permits in 2012.

Approximately 9,455 new apartments were constructed, matching nearly 1-to-1 the number of apartments that were deregulated. Many- if not most- of these new apartments are of the luxury variety, and do nothing to stem the loss of affordable housing in New York City.

The two reports issued today depict a rent stabilization system facing planned obsolescence, and a resilient real estate industry that expanding while other segments of the economy contract. An oversized rent increase will hasten both of these trends, and push the city further into its housing crises. For these reasons, and for all those articulated in previous Rent Guidelines Blog analyses, we contend that the board should act with restraint and pass as low a guideline as possible.

Monday, May 20, 2013

Urban rents and suburban poverty

The New York Times published an article today on a new study from the Brooking Institution that shows rising poverty in the New York suburbs. How does this relate to the NYC RGB? The Times reports that one of the leading factors behind this phenomenon is the disappearance of affordable housing in the city. 
"Christopher Jones, vice president for research of the Regional Plan Association, blamed higher housing prices for the demographic shift. The rising cost of shelter pushed poorer people out of Manhattan and Brooklyn, in particular."
New York's rent regulations were spurred by an urgent "housing crises."  That crises continues to rage today, and is causing working and middle class households to leave the city in search of lower cost options. If New York City hopes to retain these residents and workers, it must consider the impacts of high rent increases for rent stabilized apartments, and issue the lowest possible guideline in 2013.

Here's the article that appeared in today's New York Times:

Suburbs’ Share of Poor Has Grown Since 2000

By SAM ROBERTS

 
The suburbs, which in 2000 accounted for 29 percent of the region’s poor people, a decade later were home to 33 percent of metropolitan New Yorkers living below the federal poverty level, according to an analysis of the latest census results.

The analysis, released on Monday by the Metropolitan Policy Program of the Brookings Institution, also found that while the number of poor people in New York City and Newark declined by 7 percent, or 120,000, the number in the suburbs rose by 14 percent, or 100,000, from 2000 to the census’s rolling 2008-10 American Community Survey.
The poor have typically been concentrated in big cities and rural America. Increasing poverty in the New York metropolitan area’s historically affluent suburbs mirrored a national trend detailed in the analysis, “Confronting Suburban Poverty in America” by Elizabeth Kneebone, a fellow at the Metropolitan Policy Program, and Alan Berube, a deputy director of the program.
The first decade of the 21st century was a tipping point, the authors wrote. Suburbia, they said, is now home to the “fastest-growing poor population in the country.”
While New York and Newark’s combined share of poor people in the region dipped from 71 percent to 67 percent, the cities were home to twice the 800,000 or so people who officially qualified as poor in the suburbs in 2010.
“It seems like as the city prospered and got more expensive over the 2000s, poverty crept up in a lot of the region’s older suburban communities,” Mr. Berube said.
“It might not have been people moving from city to suburban neighborhoods per se, but as the region creates more low-wage jobs, and attracts more new immigrants, low-income households that in the past might have located in the Bronx or Brooklyn are now settling in places like northern New Jersey and Westchester County.
“It’s telling that the city’s ‘suburban’ borough, Staten Island, is the only one that saw its poor population increase over the 2000s.”
Christopher Jones, vice president for research of the Regional Plan Association, blamed higher housing prices for the demographic shift.
The rising cost of shelter pushed poorer people out of Manhattan and Brooklyn, in particular.
Also, he said, a smaller percentage of workers from suburban areas like Nassau County were commuting to high-paying jobs in Manhattan, and the jobs that were in their hometowns were at shopping malls, in health care and in landscaping, and generally paid less.
At the same time, tenants were doubling up and living in illegal apartments.
Dozens of smaller cities, townships and boroughs registered double- and even triple-digit increases in their poverty rates over the decade.
Among the places where the population of poor residents increased since 2000 were, in New Jersey, Bayonne, Bergenfield, Clifton, Edison Township, Garfield, Hoboken, Hunterdon County, Lakewood, Linden, Mount Olive, New Brunswick, Passaic, Paterson, Perth Amboy, Raritan, Summit, Teaneck and Woodbridge; on Long Island, Brookhaven and Glen Cove; in Westchester, Ossining; in Putnam County, Carmel; and in Rockland County, Ramapo.
Poverty rates increased in some places even after the recession officially ended in 2009, according to the Brookings analysis, but the poor population declined from 2000 to 2010 by 11 percent in Brooklyn and by 10 percent in Manhattan.
It rose 18 percent on Staten Island.
According to federal guidelines, the current poverty level for a family of four is annual income below $23,350.

Friday, May 10, 2013

THE WORST ROOM

So you've been displaced from your rent stabilized apartment because you couldn't afford the rising rents. Where can you go? Take a look at "THE WORST ROOM" for a sampling of what's available in New York these days.


THE WORST ROOM is getting a lot of buzz (see herehereherehere...). But it wouldn't be funny if it weren't true. There's a terrible shortage of apartments in New York City, and what's available is often laughably uninhabitable at infuriatingly high rents. Another year of high guidelines would undoubtedly send many renters over the edge, and into a market full of unaffordable "affordable housing" and luxury-priced shoe boxes.


Thursday, May 9, 2013

(Un)affordable Apartments

A good apartment is hard to find. As two recent stories documented, even those supposedly “affordable” units included in large developments are out of reach for the average New Yorker.

Curbed pointed out that the “affordable” apartments in one new TriBeCa tower are only available for households with incomes ranging from $73,166 to $150,325. That would exclude the vast majority of renters, whose average income is about half the low end of this scale. “Affordable” rents in this building begin at over $2,000, nearly double the average rent per unit citywide.


Uptown a bit, The Daily News found that the promised “affordable” apartments in the Hudson Yards development have not materialized in the promised quantities, and those that have been built are tiny. They write:
“Many of those units are tiny studios and one-bedrooms of 400 to 600 square feet — often far smaller than similar market-rate units in the same buildings. At one site, the twin 60-story Silver Towers on W. 42nd St. and 11th Ave., developer Larry Silverstein erected a separate 88-unit 'affordable' building at the back of his complex. 
The towers boast spacious and luxurious lobbies and the biggest indoor pool in the city. The affordable building has a dark, tiny lobby that faces the back of an MTA bus depot and the entrance to the Lincoln Tunnel.”
Community Board 4, when they first rejected this plan, described this housing as “separate and unequal,” saying that it has “the look and feel [of] the maids’ quarters for the rest of the project.”

It’s important to keep this in mind when people point to subsidized housing- often in “80/20” packaging- as an alternative for those priced out of rent regulated housing. The apartments created through these incentives are no replacement for affordable, integrated rent stabilized housing.

At the preliminary vote, a landlord representative stated that rent regulated housing is not the “housing of last resort” for poor tenants. If they are priced out of rent regulated housing, they are clearly not going to find a home in these “affordable” apartments. Waiting lists are growing for public housing. Where, exactly, should tenants go if rising annual rent increases price them out of rent stabilized housing?

Tuesday, May 7, 2013

NY Observer: "The Return of Hooverville"

The New York Observer has published an important feature about the explosion of homelessness in New York City. More and more families are entering the shelter system every day. Many of them have been priced out of their apartments, and cannot find new affordable accommodations. This is one piece of the growing affordability crises in New York, which tenants described to the Board in testimony on April 25th (see samples here and here).

The RGB alone cannot solve homelessness, but they have the power stop to the rent increases that have put so many families on the street. The "Supplemental Rent Increases" the board has considered in recent years have disproportionately hurt very low income tenants; stopping this practice would be an important step in the right direction.

An excerpt from "The Return of Hooverville: The Deepening Crises of Family Homelessness":
Brooklyn is now the second most expensive place to live in America (after Manhattan), with townhouses that sell for $12 million and jars of pickles that sell for $9, but nearly half of its population can’t afford to live there. According to a recent study from the Center for an Urban Future, almost 40 percent of the borough’s population works in low-wage jobs, making less than $27,000 a year. At that salary, affordable rent (affordable is defined as costing no more than 30 percent of income) tops out at $675 a month. Minimum-wage workers can’t afford to pay more than $375 a month—a virtual impossibility.
A lot of people make do, of course. They triple up with relatives, live four to a room, work two jobs, display the scrappy ingenuity and hardscrabble bravado that we like to think of as quintessentially New York, until something goes wrong.
The huge increase in families seeking shelter is proof of how precarious the lives of New York’s working poor are.

Click here to read the full article.

Friday, May 3, 2013

Testimony: Gregory Lobo Jost, UNHP

At the apartment tenants' Invited Group Testimony before the RGB, University Neighborhood Housing Program Deputy Director Gregory Lobo Jost presented some extremely important information gathered and presented in UNHP's new report, Nowhere to Go: A Crises of Affordability in the Bronx. UNHP's testimony and report take a comprehensive look at the housing affordability crises in the Bronx, and ask how it is that in many neighborhoods, more than half the renters spend in excess of 50% of their income on rent. Nowhere to Go looks at numerous factors, including changes in the regional economy, immigration patterns, historic ebbs and flows of population, rates of eviction in Bronx housing court, and more. One thing is certain: with Bronx tenants suffering through outrages rent burdens, a high RGB rent increase will be a severe hardship for many tenants.


Wednesday, May 1, 2013

The Preliminary Vote

Last night, the RGB conducted their preliminary vote, and set a range of percentages for the board to consider at the final vote in June. For the most part, the proceedings went according to schedule: the owner representatives proposed a high guideline (7% for 1-year leases and 11% for 2-year leases); the tenant representatives proposed a rent freeze; both were rejected by the public members, who instead voted as a block for the Chair’s proposal (3.25% - 6.25% for 1- year leases and 5% - 9.5% for 2-year leases). A similar dynamic was at play for the SRO vote: landlords proposed a 3% increase, and were rejected; tenants proposed 0%, and were rejected (with one abstention); the Chair proposed a range of 0% - 3% increases, effecting only buildings with 85% or more occupied SROs, and it was passed unanimously. This is what was reported in the press, which tends to focus on the familiar “ horse race” element of the RGB. With landlords and tenants unhappy, this trope implies, the RGB must be doing the right thing.

This narrative, however, glosses over some interesting moments in the margins. It fails, for example, to look historically at these rates. Since the RGB began using a range for their preliminary vote in 2004, the average range has been 2.89% – 5.14% for 1-year leases, and 5.1% – 7.69% for 2-year leases. Last night’s vote resulted in an uncommonly high range.

The public narrative also fails to interrogate the source of these approved preliminary guidelines. As the Chair stated during the vote, they come straight out of the Price Index of Operating Costs (PIOC) report, which closes with a sample set of guidelines that would keep landlords profits steady. Readers of the Rent Guidelines Blog know that we are critical of the PIOC’s centrality in Board decisions- it is just one report produced by RGB staff, and it is not in and of itself an accurate measure of landlord costs. As discussed earlier, it is simply a measure of prices, not costs.

The PIOC names a “‘Net Revenue’ Commensurate Adjustment with Vacancy Increase”, which is an estimate of how much rents would have to rise to keep landlords’ Net Operating Incomes steady, with the assumption that some percentage of tenants will leave and the landlords will receive vacancy bonuses. What would that increase be? 3.25% for1-year leases, and 6.25% for 2-year leases, exactly the low-end of the increase proposed by the Board Chair and approved by all of the public members. The PIOC also names a “‘Net Revenue’ Commensurate Adjustment”, assuming no vacancy bonuses will be taken by the landlord. This figure is listed as 5% for 1-year leases, and 9% for 2-year leases. The high end of the range voted on last night comes directly from these figures: 5% for 1-year leases, and 9.5% for 2-years. (It is not at all clear, however, why the Board voted to grant the landlords an extra half percent on the high end of the 2-year lease range.)

After months of public meetings, pouring over scores of data and debating their merits, the board settled on the figures provided for them in the PIOC to keep landlords whole. What about the Income and Affordability study, which outlined the woeful economic circumstances for tenants? What about the Income and Expense study, which showed rising revenues for landlords in an otherwise stagnant economy? What about the Mortgage Survey, which showed a healthy market for buying and selling rent stabilized properties? What about the report from the Furman Center, which spoke to the crises facing thousands of tenants after Hurricane Sandy? What about the testimonies from Bobby Sackman, Tom Waters, Gregory Lobo Jost and Barika Williams, which spoke both to tenant hardships and opportunities for landlords to reduce costs at no expense to tenants? For that matter, what about the landlord’s testimony, which confirmed that the vast majority of rent stabilized apartments are owned by very large real estate companies, often controlled by private equity? All of these factors should have pointed to a lower preliminary guideline. The fact that the Board voted on the numbers straight out of the PIOC, and even inflated them slightly, is discouraging to tenants and their advocates.

It is also interesting that this year’s range starts at a rate higher than last year’s final guideline, all but assuring a rise in the rate of rent increases for 2013. Even if they disagree on the merits of a rent freeze, it is disappointing that the board seems to have foreclosed on the possibility of a lower rent increase this year.

Finally, the Board Chair rejected amendments from both owner and tenant representatives to carve out more specific guidelines. The owner representatives, as usual, proposed a “supplemental rent increase,” imposing a disproportionate rent increase on lower rent apartments. As CSS’ testimony shows, this increase falls primarily on low income tenants, and can therefore be characterized as a poor tax. We commend the Chair for rejecting this supplemental increase, and urge the Board to reject it at its final vote in June.

The Board also rejected provisos from the tenant members, which would have limited rent increases to buildings with a solid majority of rent stabilized apartments. Buildings that are 60% or more market rate, they argued, do not need RGB rent increases to meet expenses. This proviso was also rejected as a matter of procedure- the Chair decided that provisos will only be heard at the final vote, after tenants and owners have had a chance to testify before the board. We therefore encourage tenants to talk about how much of their building they believe has been decontrolled, and we encourage board members to ask landlords what percent of their stock is subject to rent regulation.

This year's preliminary vote established a historically high range of rates. We urge the board, in its internal deliberations and its final vote, to consider establishing the lowest possible guideline.

Tuesday, April 30, 2013

Testimony: Tom Waters, CSS

Last week, the RGB heard testimony from advocates for apartment tenants, apartment owners, and SRO tenants. (SRO owners, for whatever reason, declined to testify.) Tom Waters, Housing Policy Analyst for the Community Service Society, spoke expertly about the increasing hardships facing tenants, the pressures rising rent burdens put on households, and the regressive nature of the "supplemental increases" that the board has passed in recent years. Below is a transcript of Mr. Waters' testimony, with accompanying charts. For more analysis, check out CSS' new housing report, "Good Place to Live Hard Place to Work", written by Tom Waters and Victor Bach.

http://www.cssny.org

Invited Testimony
Tom Waters and Victor Bach
Housing Policy Analysts
Community Service Society of New York
At Public Meeting
New York City Rent Guidelines Board

April 25, 2013

Thank you for the opportunity to present our concerns about the potential impact of this year’s RGB decisions on low-income New Yorkers. Rent-regulated apartments are still the primary source of housing for the city’s 1.1 million low-income[1] households—about two out of five of these families will be affected by the rent guideline increases set by this body. Only 18 percent of the city’s low-income rent stabilized tenants have a Section 8 voucher, leaving more than 336,000 poor and near-poor households without one. The slow recovery of the city’s economy is still not producing enough jobs, with dire consequences for these low-income renters. The unemployment rate remains at 8.9 percent,[2] almost double its level before the financial crisis of 2007.


Tenant Experience in the Private Rental Market, Pre- and Post-Recession

The 2011 New York City Housing and Vacancy Survey and the 2011 American Community Survey, both conducted by the U.S. Bureau of the Census, are still the most recent sources of statistical information on New York City’s rents and incomes. These surveys allow us to draw a picture of New York tenant experience before and after the recession. The city’s continued high unemployment rate suggests that this picture remains largely accurate in 2013.
Chart 2 describes rent and income shifts experienced by tenants in private unassisted rentals over the three most recent HVS studies conducted in 2005, 2008, and 2011. Net increases in median rents over the six-year period vastly outpaced net gains in median incomes for the typical renter. Overall, rents soared to a net gain of 31 percent over the six years, compared to an income gain of only 12 percent. The disparity between the two is a clear indication of rapidly rising rent burdens, the portion of household income that is paid for rent.
The disparity between rent and income trends is evident in both rent-regulated and unregulated apartments. Even under regulated rents, the median contract rent escalated by 26 percent over the six years, more than twice the 12 percent net increase in median renter income. In unregulated units, rents increased by 36 percent against an increase in tenant incomes of 25 percent. Belts tightened for all tenants, regulated and unregulated, as rent escalation took a larger and larger bite out of household income, leaving families with less residual income to cover other non-housing living costs.
The triennial HVS surveys also confirm the dramatic impact of the recession on renter incomes and their ability to keep up with rising rents. Median income increases roughly paralleled rent increases through 2008, a growth period in the local economy, after which there is post-recession fall-off in household incomes while median rents continue to escalate.


ALL PRIVATE RENTALS
2005
2008
2011
Median Contract Rent
$900
$1,000
$1,176
Median Household Income
$38,000
$44,000
$45,000
REGULATED RENTALS


Median Contract Rent
$832
$909
$1,050
Median Household Income
$33,700
$38,000
$38,132
UNREGULATED RENTALS


Median Contract Rent
$1,000
$1,200
$1,369
Median Household Income
$44,000
$50,200
$55,000


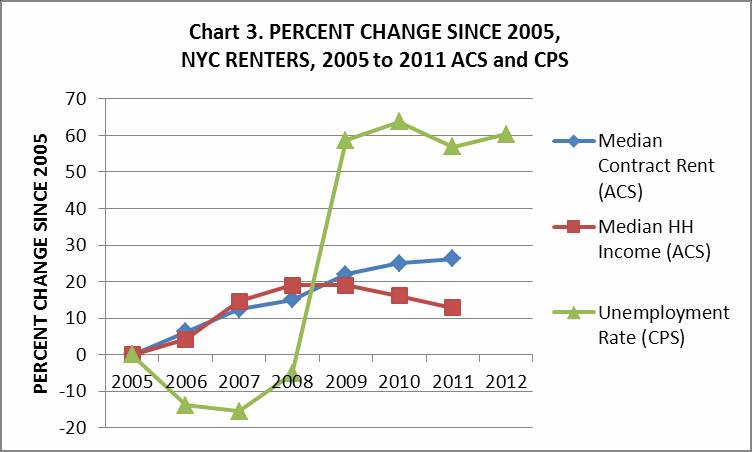
The ACS data provide a clearer annual picture of rent and renter income trends from 2005 through 2010, which we compare to city unemployment[3] in Chart 3. Again, the picture is one of persistently rising median rents through the six years against median renter incomes that rose through 2008 and fell off dramatically while the unemployment rate was high from 2009 to 2011.
Unemployment declined from 2005 to 2008 during the city’s upward economic cycle, then spiked in 2009 and 2010 following the recession.[4] Per capita household residual income—the income remaining per member once rent is paid—is arguably the best proxy for rent-income stresses, because it takes into account household size. As a whole New York tenants across the rental sectors experienced a net loss of over 2 percent in residual per capita income (constant 2010 dollars), largely occurring after 2008. Once the recession struck, New York renters, regardless of income, had to tighten their belts to make ends meet and keep up with market rents that persistently increased while rising unemployment and an unfavorable labor market were taking a toll on tenant incomes. 


It can be assumed that the picture for renters in unassisted private apartments, particularly lower-income renters, is bleaker than the ACS data indicate. ACS data do not distinguish among the range of housing types that renters occupy, from public housing to private government-subsidized housing, to private unassisted rentals, both regulated and unregulated. As a result the ACS renter population includes over 300,000 households who live in government-assisted housing, where rents are affordable and based on income. Even so, the ACS data point to a rapid rise in the incidence of high gross rent burdens (rent plus utilities at 50 percent or more of income) to new highs over the 5-year period, with a net 3.7 point post-recession increase between 2008 and 2011. (See Chart 4.)


Low-Income Tenants in the Private Rental Market, Pre- and Post-Recession

               The experience of low-income tenants in the private rental market mirrors that of renters throughout the city. But because their unemployment rates are roughly double those of renters as a whole[5], the impacts on rent-income stresses and residual incomes is much more severe. Chart 5 confirms the extent to which net rent increases over the 6-year period outpaced income gains. Surprisingly, based on the 2005 starting points, the net rent increases in regulated units (29 percent) exceeded those in unregulated apartments (25 percent). By comparison, household incomes increased by from 14 percent.
               Residual per capita incomes declined sharply by 11 percent for low-income renters, but the impact was far more severe in the unregulated market (21 percent decrease) than in the regulated market (7 percent decrease). In short, the dynamics of an escalating local rental market, combined with the post-recession effects on employment and income, have left low-income renters in far worse economic circumstances than they were in before the recession.


ALL PRIVATE RENTALS
2005
2008
2011
Med. Contract Rent
$800
$900
$1,000
Med. Household Income
$15,000
$16,000
$17,160
Med. PC Res Inc Mo ($2011)[6]
$388
$371
$346
REGULATED RENTALS


Med. Contract Rent
$750
$830
$966
Med. Household Income
$14,000
$15,000
$16,220
Med. PC Res Inc Mo ($2011)
$395
$377
$367
UNREGULATED RENTALS


Med. Contract Rent
$920
$1,050
$1,150
Med. Household Income
$16,000
$18,000
$18,590
Med. PC Res Inc Mo ($2011)
$408
$368
$323

               As a result, median rent burdens and the incidence of high rent burdens (rent at 50 percent or more – this time not including utilities) among low-income renters reached a 6-year high as of 2011. (See Chart 6.) Estimates based on the CSS subsample[7] indicate a 4-point increase in median rent burdens in both regulated and unregulated apartments—a rise from 45 to 49 percent in regulated units by 2011, and from 48 to 51 percent in unregulated units. The growing incidence of high rent burdens was even more dramatic. By 2011, a majority (51 percent) of low-income renters in the market were carrying burdens of at least half their incomes, up from 43 percent in 2005. In the regulated stock, high rent burdens rose from 45 to 49 percent of low-income families.


Supplemental rent increases

The New York City Rent Guidelines Board sometimes considers adding extra rent increases for apartments renting for under $1,000. They added such a supplemental increase last year.
This supplemental increase would seem to be based on the assumption that a $1,000 rent is excessively low. But from the point of view of affordability, this is simply not true. In 2010, the median income for rent-stabilized tenants was $38,000. That means that for half of the tenants affected by the RGB’s actions, an affordable rent (30 percent of income) is no more than $950.
The tenants living in the city’s under-$1,000 rent-stabilized apartments are primarily people who cannot afford more. Their median income is $28,000, and half of them have incomes below twice the poverty line (23 percent poor and 29 percent near-poor). More than half of these tenants (54 percent) live in lower-rent areas of the Bronx, Brooklyn, Queens, and Staten Island. Just 10 percent live in Manhattan below Harlem, 13 percent in Upper Manhattan, 8 percent in the gentrifying areas of Brooklyn and Queens adjacent to Manhattan, and 15 percent in higher-rent outer-ring neighborhoods such as Flushing or Bay Ridge. Three quarters of these tenants are people of color: 30 percent black, 38 percent Latino, and 6 percent Asian. Almost half (47 percent) are in households headed by an immigrant.

Conclusions

In light of rent escalation trends that persisted before and since the recession struck the city, it would appear that the private rental industry has not suffered a decline as a result of the economic crisis, certainly not a decline comparable to the losses in income and employment that continue to beset New York renters, particularly low-income tenants.
Certainly the impacts of a global recession and financial crisis on the income and employment of New Yorkers, and their ability to pay for their apartments, are hardly within the control of the city or of the RGB. However, RGB decisions over recent years have contributed significantly to the growing rental affordability crisis at this stage of the presumed recovery. At a time when the RGB should have exercised restraint to ease the impacts of the recession on its struggling resident constituency, it has tended to err on the side of owners by granting larger guideline increases than were necessary.
In recent years, the RGB has overestimated projected operating costs compared to the actual cost increases later reported in owner surveys, resulting in excessively high guidelines. The 2009 Price Index of Operating Costs projected a 4 percent increase, and the RGB adopted a guideline of 3 percent – a little more than enough to cover the projected increase in expenses, given that operating costs consume less than 75 percent of rent.  But the actual increase in costs as measured by Real Property Income and expense statements was only 0.1 percent. In 2010 and 2011, the Price Index again greatly overestimated cost increases. Chart 7 shows the evolution of the Price Index, rent guidelines, and RPIE costs since 1990, clearly showing the great divergence in recent years.  This divergence has resulted in higher, unaffordable rent increases for tenants.
This is an important time for the RGB to reflect on and revise the methodology it uses to determine what it considers reasonable rent guideline increases. Before and since the recession struck the city, it has tended to over-compensate owners to the expense of rent-stabilized tenants. This is certainly a time for the RGB to exercise greater restraint by keeping guideline increases to a minimum, for an industry that appears to be prospering in the wake of recession. RGB should consider its unique potential contribution to stabilizing the rental market and easing the rent-income stresses that New Yorkers continue to experience.


Recommendations

1)    CSS urges the New York City Rent Guidelines Board to take into account the disastrous effects of the recession on many New Yorkers, regardless of income, and exercise overdue restraint in setting new, minimal rent guideline increases. In past years CSS has recommended a rent freeze; we continue to do so in light of the persistent rent escalation that has benefited the industry in the face of a major economic set-back for many tenants.
2)    CSS urges the RGB to refrain from further supplemental increases at lower rent levels—what tenant advocates refer to as the “poor tax.” RGB should do its best to minimize increases at the low-rent levels where the poorest tenants tend to live.


APPENDIX: CSS Renter Sub-Sample

Because of unavoidable inconsistencies and inaccuracies, in respondent reporting of household income and contract rent, this analysis of rent burdens is based on a sub-sample of renter households within each of the HVS samples used. The CSS renter sub-sample for each HVS year was selected on the following basis:
               1) Rent-paying households only (exclude rent-free and owned housing)
               2) Head of household age at least 25 and less than 65.
               3) Households with a positive HVS contract rent burden
               4) Households within the middle 90 percent of the income distribution for renters
(excludes 5-percent outliers at either extreme) . The resulting household income intervals used for each HVS year are as follows:
               2011    $7,896 to $175,000
               2008    $6,912 to $160,000
               2005    $6,006 to $133,000
               2002    $6,000 to $130,000
               1999    $5,700 to $131,000
               1996    $5,000 to $119,950
5) Households within the middle 90 percent of the contract rent distribution for renters (excludes 5-percent outliers at either extreme.) The resulting contract rent distributions used for each HVS year are as follows:
               2011    $342 to $2,800 monthly
               2008    $252 to $2,500 monthly
               2005    $208 to $2,100 monthly
               2002    $200 to $1,900 monthly
               1999    $177 to $1,550 monthly
               1996    $163 to $1,300 monthly
6) Residual (after-rent) household income of at least $100 monthly, in 2002 dollars. For each HVS year, the residual income threshold, in 2002 dollars, was:
               2011    $129
               2008      $123
               2005    $111
               2002    $100
               1999    $93
               1996    $87

The resulting CSS sub-sample can be considered a more "mainstream" sample of New York City renters than the HVS renter sample as a whole. The comparison below of some of the key parameters for each of the two samples suggests that the CSS results are more likely to underestimate rent burdens and related measures of rent-income pressures for the city as a whole.


Comparison: HVS and CSS Renter Samples

                              1996                   1999                   2002                   2005                   2008                   2011

Median Income         
HVS:                    $24,680             $27,600             $32,000             $33,904             $40,000             $40,000
CSS:                     $31,000             $35,000             $39,000             $40,050             $46,400             $50,000

Median Contract Rent                         
HVS:                    $ 600                  $ 648                  $ 706                  $ 850                  $ 950                  $1,100
CSS:                     $ 600                  $ 650                  $ 730                  $ 850                  $ 996                  $1,100

Median Contract Rent Burden       
HVS:                   28 %                   27 %                  27 %                  28 %                  29 %                  31 %
CSS:                    24 %                   23 %                  23 %                  25 %                  25 %                  27 %

Percent Households with High Burdens (50% or more)
HVS:                   26 %                   26 %                  23 %                  26 %                  26 %                  29 %
CSS:                     12 %                   12 %                  12 %                  14 %                  15 %                  18 %


ENDNOTES

1 Preliminary estimate from the U.S. Department of Labor’s Bureau of Labor Statistics.

We use the term “low-income” to refer to households with incomes no greater than twice the federal poverty threshold, in 2010 about $34,114 for a family of three persons. Household incomes recorded in each HVS are for the previous calendar year. Low-income households include the poor, as well as the “near-poor” with incomes above poverty but no greater than twice the poverty threshold.

Unemployment rates are calculated by the Bureau of Labor Statistics from the Census Bureau’s Current Population Survey.

4 Unemployment figures are for individuals at least 18 years old and below 65.

5 ACS 2005-2010 data estimate renter unemployment rates of 9, 8, and 12% for 2005, 2008, and 2010 respectively, against unemployment rates of 19, 15, and 22 % for low-income renters.

6 Median monthly per capita residual income figures were calculated only for the CSS renter subsample (See Appendix)

7 For description of the CSS subsample, see Appendix.