Showing posts with label Costs. Show all posts

Monday, June 24, 2013

The 2013 Guidelines in Context

With one quick vote, the 2013 New York City Rent Guidelines Board process came to a close Thursday night, with the board approving apartment increases of 4% for one year leases and 7.75% for two year leases, with a rent freeze imposed for Single Room Occupancy apartments.

For those of tenants who have engaged with the process for the past third of a year, it was a startling end and a disappointing result.

In the media narrative and in the popular imagination, the RGB’s final vote is a raucous and chaotic battle between ever-warring constituencies, representing contentious democracy at its best or worst (depending on the perspective). This is a myth. The vote is shockingly dull, and executed with an efficiency born of repetition.

The scene Thursday was ritualistic: the tenant members proposed a low increase; the owner members proposed a high increase; the public members voted unanimously in between the two, appearing as magnanimously Solomonic in the process. The press played its part, reporting equally on the tenants’ and landlord’s frustrations with the result. When the vote was over, landlord representatives spoke to reporters, lit cigars, and posed for pictures with Jimmy McMillan.

The result of this process, however, in anything but dull- it is a recurring regressive redistribution of wealth from tenants to landlords. This year’s increase will be particularly painful. At 4% and 7.75%, the rent hike is not only the largest since before the recession, as reported in the press, but is also higher than the average increase under RGB Chair Jonathan Kimmel (3% and 5.88%, including the 2013 guidelines), higher than the average increase for the much-maligned former Board chair Marvin Markus (3.44% and 6.38%), and in fact higher than the average RGB increase for the board’s entire history (3.3% and 5.84%).

If there is any silver lining to the vote, it is that the Board rejected landlords’ calls for a “supplemental” or “minimum dollar” increase, which would have disproportionately stressed the budgets of low income and senior tenants. Tenant advocates wonder, however, if they are being forced into a pattern of relatively low increases with pro-landlord provisos (like the 2012 vote) followed by high increases without them (as we saw this year).

The board also chose to freeze rents completely for SROs, dispensing with the usual provision that the rent freeze applies only to buildings with a certain percentage of occupied SRO units. This is a victory for SRO tenants and their advocates, and it should be celebrated.

The SRO rent freeze should not, however, overshadow the impact the Board’s apartment increases will have on an estimated 2.5 million tenants throughout the city. In addition to being a mid-recession transfer of income from renters to property owners, this rent increase will be another constraining factor on New Yorkers’ ability to make ends meet. It will force many to chose between rent and other necessities of life, not to mention the less vital aspects of commerce that keep the city running. It is certainly no stimulus to our depressive economy.

The high increase will also encourage many tenants to sign one year leases, rather than two. Even though a two year lease presents tenants with a slight (.25%) benefit over a one year lease, many low income tenants will not be able to shoulder the up-front costs of a 7.75% increase. This adds an additional layer of regression to the 2013 guidelines, as those most equipped to save with a two year increase are those most able to pay higher up-front costs- i.e. higher income or higher net-wealth households.

Finally, this increase cements the Board’s image as a guarantor of landlord profits. Whether by inertia or design, the Board has repeatedly chosen to increase rents to cover for any perceived fluctuations in the cost of running a rent stabilized apartment. This should not be a forgone conclusion; given that landlords have many ways of making profit off their buildings- everything from commercial rents to cell phone towers to the dreaded Major Capital Improvement- there is no need to continuously fall back on renewal lease rent increases to recoup landlords for any change in costs. The board must also rethink the way it calculates these costs, as numerous reports have shown that the Price Index of Operating Costs- the board’s main tool for estimating prices for goods purchased by landlords- seems to overstate real expenses. Whether that is because landlords find a way to economize their purchases or because the prices are overstated, we do not know. All we know is that the price data overshoots the expense data, and is leading Board members to vote for inflated guidelines.

Next year will bring in a new Mayoral administration, and with it a new Rent Guidelines Board. Fixing this broken institution should be a major priority for the next Mayor, both in terms of making responsible appointments and rethinking the Prince Index of Operating Costs. The Mayor should also call on the next Board Chair to hold more public hearings at times and places convenient to the majority of rent stabilized tenants, and present a full accounting of the Board’s decision to the City Council and the public at large. While it is the State Legislature that has the power to rewrite the rules regarding the RGB, it is in the Mayor’s power to change the culture of the Board. Elected officials have spoken out against these increases, and called for Board to change its ways (see examples here, here, and here). Tenants have made their voices heard throughout this process, whether at the People’s RGB, the formal public hearing, or the vote itself. We all know this system flawed; the process must be reconsidered before the board meets again in 2014.

Testimony: Kelley Boyd

The following testimony was presented by Kelley Boyd, a tenant in Washington Heights who has been actively fighting illegal overcharges in her building:

Hello, I am Kelley Boyd and I am a technologist working in the city’s startup movement. I have lived in the Washington Heights neighborhood for over 6 years and have become very active in the community. As an entrepreneur advocate I believe the biggest problem facing our culture is the unbelievable rents in the city. We could start more businesses and bring more fiscal diversity to the city with better rent oversight. Though I believe in a free market - many landlords have gotten the benefits they signed up for whether they deliver the value the city has bargained for or not! Full disclosure - most of my knowledge / experience in this area of springs from my having filed a rent overcharge complaint at HCR. At this time that claim is still in process.
Through the experience I have learned a lot about what is happening in my building – and in many buildings in my area. People are fleeing the exorbitant rents and moving to "WaHi" thinking they are getting a great deal when in reality they are paying "market rates" and over for apartments that should be rent stabilized. The new tenants are unaware that the apartments have been illegally deregulated because of the scheming of well schooled landlords. Our area is being hit especially hard because we are a largely residential neighborhood that has not seen the turnover of other areas which means there are lots of apartments that should be in the $900 - $1200 range but are being rented at $2000 and more. The landlords know how to work and beat the system that is supposed to keep them honest by inflating improvements, claiming false improvements and just filing false documents with HCR. Even if they are not lying, cheating and stealing, LL are in an enviable position as of now. It was reported just yesterday that Manhattan rents have soared 3.5% with median rent at $3200 - rent today is just $13 shy of an all time high! 
Owners should bear their fair share of economic burden because their profits are increasing. 
I do not begrudge anyone success but I estimate my LL has collected well over a million dollars in illegal overcharge in the last 5 years, and those are just the 5 apartments in my building that I know about! Add to that he inherited the buildings and has no mortgage on them, in fact hold them in trust in Texas to better manage his tax liability. Figure that he owns three buildings with another 11 under management and you can extrapolate that there is a big number to be at years end in someone’s account... he and his kind certainly do not need your help increasing rents and making money off their
buildings. 
RECOMMENDATIONS
I understand that the RGB serves a wide variety of constituents and in doing so you must make determinations that are fair to large and small landlords alike, all the while keeping true to the statutes and the spirit of fairness that tenants rely on you for. It used to be “impossible” to reliably get enough information from “everyone” and their unique situation but I think in real terms it is much easier than it ever has been. As a technologist there are ways to better manage the burden of how to treat landlords and tenants fairly in this process. Small landlords who are absolutely getting squeezed with resource increases and having a tough time with outstanding building repairs and improvements should have the mechanisms in place to apply for an receive relief in the form of increases, waivers or temp variances from codes. I have absolutely no heartburn with that. But there are so many that are not really challenged in their circumstances and are taking advantage of unwitting tenants, and then more that are simply thieves. 
The RGB should embrace innovation and craft a process that allows for some kind of "means test" for buildings when rent increases are in review. In my opinion there should be NO MORE RENT INCREASES AT ALL until you have a system in place to grant increases fairly.

Wednesday, June 19, 2013

Testimony: Mariel De La Cruz

The following testimony was presented by Mariel De La Cruz, a rent stabilized tenant in Washington Heights and a tenant organizer in HUD-financed buildings across New York state:
My name is Mariel De La Cruz a rent stabilized tenant in the beautiful Washington Heights neighborhood in Manhattan. I have lived in the same apartment for almost exactly 19 years and wouldn't have it any other way. Now that I have grown up and have graduated Fordham College, I have come to a realization that I want to live in my neighborhood, my block, my apartment for a very long time. Many of us who attend Jesuit institutions find that they love to work with less resources themselves. Many of us go the nonprofit route, not making the big bucks. Besides what the “usual” narrative is for young people raised in Washington Heights, I work hard and I have invested my time, growth and energy to my neighborhood. Now that I take care of the bills I have been blessed enough to find full time employment, but with my many student loan payments (along with other expenses) I am still struggling to make ends meet. I am afraid that the yearly increases (especially those proposed for this year) threaten my ability to stay in the place that I know and love. 
As you all know, a rent increase from the tenants is not the only way for owners to make
a profit. There has been significant turnover in some of the units in my building, allowing for the owners to renovate the units to get the big rent increases from each of the new tenants that have moved in. In addition, there have been substantial rent increases to benefiting the landlords every year. I understand that costs for owners have gone up but like I said before owners have been getting steep rent increases every year but sadly, our incomes don’t have the privilege of doing the same. 
While most of us tenants are struggling to make ends meet, owners on average are making major profits for each rent stabilized unit they own. So what I am saying is that tenants are ever increasingly carrying the burden, while owners are and will continue to make significant revenue for each unit. This is why I believe there should be no increases this year, to ensure that tenants are not priced out of their home in this increasingly difficult time for lower and moderate income tenants in NYC. 
I ask that when you all are making your decision, you think of recent college grads like me who have full time jobs, but who are drowning in student loans that make it harder for ends to meet. I am asking you to consider some of my neighbors and family members, like my mother, who live on fixed incomes in which a rent increase would be too much to bear because their incomes don’t increase just because their rents increase. Think of those people who think of their home beyond their apartment. Please think of us.

Tuesday, April 30, 2013

Testimony: Tom Waters, CSS

Last week, the RGB heard testimony from advocates for apartment tenants, apartment owners, and SRO tenants. (SRO owners, for whatever reason, declined to testify.) Tom Waters, Housing Policy Analyst for the Community Service Society, spoke expertly about the increasing hardships facing tenants, the pressures rising rent burdens put on households, and the regressive nature of the "supplemental increases" that the board has passed in recent years. Below is a transcript of Mr. Waters' testimony, with accompanying charts. For more analysis, check out CSS' new housing report, "Good Place to Live Hard Place to Work", written by Tom Waters and Victor Bach.

http://www.cssny.org

Invited Testimony
Tom Waters and Victor Bach
Housing Policy Analysts
Community Service Society of New York
At Public Meeting
New York City Rent Guidelines Board

April 25, 2013

Thank you for the opportunity to present our concerns about the potential impact of this year’s RGB decisions on low-income New Yorkers. Rent-regulated apartments are still the primary source of housing for the city’s 1.1 million low-income[1] households—about two out of five of these families will be affected by the rent guideline increases set by this body. Only 18 percent of the city’s low-income rent stabilized tenants have a Section 8 voucher, leaving more than 336,000 poor and near-poor households without one. The slow recovery of the city’s economy is still not producing enough jobs, with dire consequences for these low-income renters. The unemployment rate remains at 8.9 percent,[2] almost double its level before the financial crisis of 2007.


Tenant Experience in the Private Rental Market, Pre- and Post-Recession

The 2011 New York City Housing and Vacancy Survey and the 2011 American Community Survey, both conducted by the U.S. Bureau of the Census, are still the most recent sources of statistical information on New York City’s rents and incomes. These surveys allow us to draw a picture of New York tenant experience before and after the recession. The city’s continued high unemployment rate suggests that this picture remains largely accurate in 2013.
Chart 2 describes rent and income shifts experienced by tenants in private unassisted rentals over the three most recent HVS studies conducted in 2005, 2008, and 2011. Net increases in median rents over the six-year period vastly outpaced net gains in median incomes for the typical renter. Overall, rents soared to a net gain of 31 percent over the six years, compared to an income gain of only 12 percent. The disparity between the two is a clear indication of rapidly rising rent burdens, the portion of household income that is paid for rent.
The disparity between rent and income trends is evident in both rent-regulated and unregulated apartments. Even under regulated rents, the median contract rent escalated by 26 percent over the six years, more than twice the 12 percent net increase in median renter income. In unregulated units, rents increased by 36 percent against an increase in tenant incomes of 25 percent. Belts tightened for all tenants, regulated and unregulated, as rent escalation took a larger and larger bite out of household income, leaving families with less residual income to cover other non-housing living costs.
The triennial HVS surveys also confirm the dramatic impact of the recession on renter incomes and their ability to keep up with rising rents. Median income increases roughly paralleled rent increases through 2008, a growth period in the local economy, after which there is post-recession fall-off in household incomes while median rents continue to escalate.


ALL PRIVATE RENTALS
2005
2008
2011
Median Contract Rent
$900
$1,000
$1,176
Median Household Income
$38,000
$44,000
$45,000
REGULATED RENTALS


Median Contract Rent
$832
$909
$1,050
Median Household Income
$33,700
$38,000
$38,132
UNREGULATED RENTALS


Median Contract Rent
$1,000
$1,200
$1,369
Median Household Income
$44,000
$50,200
$55,000


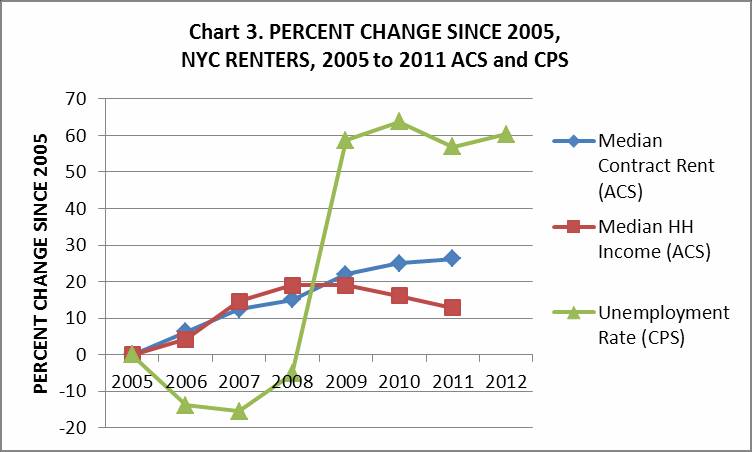
The ACS data provide a clearer annual picture of rent and renter income trends from 2005 through 2010, which we compare to city unemployment[3] in Chart 3. Again, the picture is one of persistently rising median rents through the six years against median renter incomes that rose through 2008 and fell off dramatically while the unemployment rate was high from 2009 to 2011.
Unemployment declined from 2005 to 2008 during the city’s upward economic cycle, then spiked in 2009 and 2010 following the recession.[4] Per capita household residual income—the income remaining per member once rent is paid—is arguably the best proxy for rent-income stresses, because it takes into account household size. As a whole New York tenants across the rental sectors experienced a net loss of over 2 percent in residual per capita income (constant 2010 dollars), largely occurring after 2008. Once the recession struck, New York renters, regardless of income, had to tighten their belts to make ends meet and keep up with market rents that persistently increased while rising unemployment and an unfavorable labor market were taking a toll on tenant incomes. 


It can be assumed that the picture for renters in unassisted private apartments, particularly lower-income renters, is bleaker than the ACS data indicate. ACS data do not distinguish among the range of housing types that renters occupy, from public housing to private government-subsidized housing, to private unassisted rentals, both regulated and unregulated. As a result the ACS renter population includes over 300,000 households who live in government-assisted housing, where rents are affordable and based on income. Even so, the ACS data point to a rapid rise in the incidence of high gross rent burdens (rent plus utilities at 50 percent or more of income) to new highs over the 5-year period, with a net 3.7 point post-recession increase between 2008 and 2011. (See Chart 4.)


Low-Income Tenants in the Private Rental Market, Pre- and Post-Recession

               The experience of low-income tenants in the private rental market mirrors that of renters throughout the city. But because their unemployment rates are roughly double those of renters as a whole[5], the impacts on rent-income stresses and residual incomes is much more severe. Chart 5 confirms the extent to which net rent increases over the 6-year period outpaced income gains. Surprisingly, based on the 2005 starting points, the net rent increases in regulated units (29 percent) exceeded those in unregulated apartments (25 percent). By comparison, household incomes increased by from 14 percent.
               Residual per capita incomes declined sharply by 11 percent for low-income renters, but the impact was far more severe in the unregulated market (21 percent decrease) than in the regulated market (7 percent decrease). In short, the dynamics of an escalating local rental market, combined with the post-recession effects on employment and income, have left low-income renters in far worse economic circumstances than they were in before the recession.


ALL PRIVATE RENTALS
2005
2008
2011
Med. Contract Rent
$800
$900
$1,000
Med. Household Income
$15,000
$16,000
$17,160
Med. PC Res Inc Mo ($2011)[6]
$388
$371
$346
REGULATED RENTALS


Med. Contract Rent
$750
$830
$966
Med. Household Income
$14,000
$15,000
$16,220
Med. PC Res Inc Mo ($2011)
$395
$377
$367
UNREGULATED RENTALS


Med. Contract Rent
$920
$1,050
$1,150
Med. Household Income
$16,000
$18,000
$18,590
Med. PC Res Inc Mo ($2011)
$408
$368
$323

               As a result, median rent burdens and the incidence of high rent burdens (rent at 50 percent or more – this time not including utilities) among low-income renters reached a 6-year high as of 2011. (See Chart 6.) Estimates based on the CSS subsample[7] indicate a 4-point increase in median rent burdens in both regulated and unregulated apartments—a rise from 45 to 49 percent in regulated units by 2011, and from 48 to 51 percent in unregulated units. The growing incidence of high rent burdens was even more dramatic. By 2011, a majority (51 percent) of low-income renters in the market were carrying burdens of at least half their incomes, up from 43 percent in 2005. In the regulated stock, high rent burdens rose from 45 to 49 percent of low-income families.


Supplemental rent increases

The New York City Rent Guidelines Board sometimes considers adding extra rent increases for apartments renting for under $1,000. They added such a supplemental increase last year.
This supplemental increase would seem to be based on the assumption that a $1,000 rent is excessively low. But from the point of view of affordability, this is simply not true. In 2010, the median income for rent-stabilized tenants was $38,000. That means that for half of the tenants affected by the RGB’s actions, an affordable rent (30 percent of income) is no more than $950.
The tenants living in the city’s under-$1,000 rent-stabilized apartments are primarily people who cannot afford more. Their median income is $28,000, and half of them have incomes below twice the poverty line (23 percent poor and 29 percent near-poor). More than half of these tenants (54 percent) live in lower-rent areas of the Bronx, Brooklyn, Queens, and Staten Island. Just 10 percent live in Manhattan below Harlem, 13 percent in Upper Manhattan, 8 percent in the gentrifying areas of Brooklyn and Queens adjacent to Manhattan, and 15 percent in higher-rent outer-ring neighborhoods such as Flushing or Bay Ridge. Three quarters of these tenants are people of color: 30 percent black, 38 percent Latino, and 6 percent Asian. Almost half (47 percent) are in households headed by an immigrant.

Conclusions

In light of rent escalation trends that persisted before and since the recession struck the city, it would appear that the private rental industry has not suffered a decline as a result of the economic crisis, certainly not a decline comparable to the losses in income and employment that continue to beset New York renters, particularly low-income tenants.
Certainly the impacts of a global recession and financial crisis on the income and employment of New Yorkers, and their ability to pay for their apartments, are hardly within the control of the city or of the RGB. However, RGB decisions over recent years have contributed significantly to the growing rental affordability crisis at this stage of the presumed recovery. At a time when the RGB should have exercised restraint to ease the impacts of the recession on its struggling resident constituency, it has tended to err on the side of owners by granting larger guideline increases than were necessary.
In recent years, the RGB has overestimated projected operating costs compared to the actual cost increases later reported in owner surveys, resulting in excessively high guidelines. The 2009 Price Index of Operating Costs projected a 4 percent increase, and the RGB adopted a guideline of 3 percent – a little more than enough to cover the projected increase in expenses, given that operating costs consume less than 75 percent of rent.  But the actual increase in costs as measured by Real Property Income and expense statements was only 0.1 percent. In 2010 and 2011, the Price Index again greatly overestimated cost increases. Chart 7 shows the evolution of the Price Index, rent guidelines, and RPIE costs since 1990, clearly showing the great divergence in recent years.  This divergence has resulted in higher, unaffordable rent increases for tenants.
This is an important time for the RGB to reflect on and revise the methodology it uses to determine what it considers reasonable rent guideline increases. Before and since the recession struck the city, it has tended to over-compensate owners to the expense of rent-stabilized tenants. This is certainly a time for the RGB to exercise greater restraint by keeping guideline increases to a minimum, for an industry that appears to be prospering in the wake of recession. RGB should consider its unique potential contribution to stabilizing the rental market and easing the rent-income stresses that New Yorkers continue to experience.


Recommendations

1)    CSS urges the New York City Rent Guidelines Board to take into account the disastrous effects of the recession on many New Yorkers, regardless of income, and exercise overdue restraint in setting new, minimal rent guideline increases. In past years CSS has recommended a rent freeze; we continue to do so in light of the persistent rent escalation that has benefited the industry in the face of a major economic set-back for many tenants.
2)    CSS urges the RGB to refrain from further supplemental increases at lower rent levels—what tenant advocates refer to as the “poor tax.” RGB should do its best to minimize increases at the low-rent levels where the poorest tenants tend to live.


APPENDIX: CSS Renter Sub-Sample

Because of unavoidable inconsistencies and inaccuracies, in respondent reporting of household income and contract rent, this analysis of rent burdens is based on a sub-sample of renter households within each of the HVS samples used. The CSS renter sub-sample for each HVS year was selected on the following basis:
               1) Rent-paying households only (exclude rent-free and owned housing)
               2) Head of household age at least 25 and less than 65.
               3) Households with a positive HVS contract rent burden
               4) Households within the middle 90 percent of the income distribution for renters
(excludes 5-percent outliers at either extreme) . The resulting household income intervals used for each HVS year are as follows:
               2011    $7,896 to $175,000
               2008    $6,912 to $160,000
               2005    $6,006 to $133,000
               2002    $6,000 to $130,000
               1999    $5,700 to $131,000
               1996    $5,000 to $119,950
5) Households within the middle 90 percent of the contract rent distribution for renters (excludes 5-percent outliers at either extreme.) The resulting contract rent distributions used for each HVS year are as follows:
               2011    $342 to $2,800 monthly
               2008    $252 to $2,500 monthly
               2005    $208 to $2,100 monthly
               2002    $200 to $1,900 monthly
               1999    $177 to $1,550 monthly
               1996    $163 to $1,300 monthly
6) Residual (after-rent) household income of at least $100 monthly, in 2002 dollars. For each HVS year, the residual income threshold, in 2002 dollars, was:
               2011    $129
               2008      $123
               2005    $111
               2002    $100
               1999    $93
               1996    $87

The resulting CSS sub-sample can be considered a more "mainstream" sample of New York City renters than the HVS renter sample as a whole. The comparison below of some of the key parameters for each of the two samples suggests that the CSS results are more likely to underestimate rent burdens and related measures of rent-income pressures for the city as a whole.


Comparison: HVS and CSS Renter Samples

                              1996                   1999                   2002                   2005                   2008                   2011

Median Income         
HVS:                    $24,680             $27,600             $32,000             $33,904             $40,000             $40,000
CSS:                     $31,000             $35,000             $39,000             $40,050             $46,400             $50,000

Median Contract Rent                         
HVS:                    $ 600                  $ 648                  $ 706                  $ 850                  $ 950                  $1,100
CSS:                     $ 600                  $ 650                  $ 730                  $ 850                  $ 996                  $1,100

Median Contract Rent Burden       
HVS:                   28 %                   27 %                  27 %                  28 %                  29 %                  31 %
CSS:                    24 %                   23 %                  23 %                  25 %                  25 %                  27 %

Percent Households with High Burdens (50% or more)
HVS:                   26 %                   26 %                  23 %                  26 %                  26 %                  29 %
CSS:                     12 %                   12 %                  12 %                  14 %                  15 %                  18 %


ENDNOTES

1 Preliminary estimate from the U.S. Department of Labor’s Bureau of Labor Statistics.

2 We use the term “low-income” to refer to households with incomes no greater than twice the federal poverty threshold, in 2010 about $34,114 for a family of three persons. Household incomes recorded in each HVS are for the previous calendar year. Low-income households include the poor, as well as the “near-poor” with incomes above poverty but no greater than twice the poverty threshold.

3 Unemployment rates are calculated by the Bureau of Labor Statistics from the Census Bureau’s Current Population Survey.

4 Unemployment figures are for individuals at least 18 years old and below 65.

5 ACS 2005-2010 data estimate renter unemployment rates of 9, 8, and 12% for 2005, 2008, and 2010 respectively, against unemployment rates of 19, 15, and 22 % for low-income renters.

6 Median monthly per capita residual income figures were calculated only for the CSS renter subsample (See Appendix)

7 For description of the CSS subsample, see Appendix.


Wednesday, April 24, 2013

Analysis: Income & Expense study and the Price Index of Operating Costs

Last week, the Rent Guidelines Board released two studies on economic conditions for landlords: the Income and Expense (I&E) study and the Price Index of Operating Costs (PIOC).

The I&E study is culled from documents submitted by landlords to the NYC Department of Finance in the form of Real Property Incomeand Expense (RPIE) statements. The data in this study is therefore considered to be a fairly reliable and accurate accounting of landlords incomes- from rents and other sources- and expenses in the form of operations and maintenance costs. Looking at the two together yields the “Net Operating Income”, a marker of how much money landlords are making off of their property in a year. The study presents both a snapshot of this past year’s income and expense balance (the “cross-sectional analysis”), as well as a year-to-year comparison (the “longitudinal analysis”).

The Price Index of Operating Costs (PIOC) is a figure the RGB staff creates each year based on a “basket of goods and services used in the operation and maintenance of rent stabilized apartment buildings.” This “basket” is similar to those used by the bureau of labor statistics to calculate the generalized cost of living adjustment, but it is particular to the economics of rent stabilized building ownership. The staff collects data on items like oil and gas costs, property taxes, insurance, and more, and weighs them in their sample relative to their importance as a percentage of total operating and maintenance expenses. The result of the PIOC is a single percentage, which attempts to show the change in prices for items used to operate a building in New York City.

In many ways, the I&E is the superior measure of landlord’s costs because it covers both incomes and expenses, it is based on a large and fairly reliable data set, and it measures not just the prices of goods but the exchanges in goods and services that landlords actually made. While the PIOC measures prices, it does not exactly measure costs. Landlords still have a degree of choice in the operations of their building, and can choose the most cost-efficient mechanisms options available. The I&E measures the costs landlords actually took on, not just the prices of the goods available to them.

The 2013 Income and Expense report, which is based on 2011 filings, depicts a thriving market for landlords. Rental income has risen 4.4% from the previous year, and net operating incomes (incomes minus expenses) grew 5.6%. This is the 7th consecutive year of rising NOI, in a period of severe economic recession. Not only are rent stabilized landlords doing well in an otherwise sick economy, but their profits have risen dramatically over time. In inflation adjusted dollars, NOI has risen 21.6% since 1990. NOI in Brooklyn has sky-rocketed over the same period, rising 59%. In short, with income rising faster than expenses, rent stabilized building owners continue to realize a healthy profit, while many tenants struggle through a punishing economy.

The Income and Expense report also depicts a growing trend: preferential rents. While rent stabilization is generally understood to result in below market rents, the opposite is actually the case in a growing portion of the city. For the 4th consecutive year, the “collectible rent” in rent stabilized apartments is lower than the “legal regulated rent”. The most likely reason for this trend (depicted below) is that after years of RGB rent increases, rent stabilized rents have surpassed market levels in many neighborhoods, and landlords are offering apartments at lower “preferential rents.” This growing portion of landlords needs no rent increase from the RGB to meet its expenses; in fact, they are already shorting themselves a significant share of their allowable rents. This topsy-turvy market, in which regulated landlords are voluntarily lowering actual rents while theoretical rents rise, is reason enough to question the inevitability of annual RGB rent increases.

The declining share of registered rents collected suggests that
ever-rising regulated rents are outpacing market forces.
(Trend oval added by RGBlog.)

The RGB’s 2013 Price Index of Operating Costs presents a picture of rising prices for goods purchased by landlords. The PIOC inched up 5.9% this year, due largely to increases both in generalized fuel costs and in the amount of fuel landlords used in this relatively cold and rainy winter. Insurance costs also rose, possibly as a result of hurricane Sandy.

It’s important to note, however, that the PIOC is a measure of prices, not costs per se. While prices and costs are of course related, there are many things a landlord, just like any business owner or market consumer, can do to keep costs low as prices rise. Nonprofit building owners all over the city have found ways to keep costs as low as possible, while only raising rents as a last resort. Often these cost efficiencies also result in environmental benefits, and are subsidized by the state, providing even lower costs.

If you look closely at the data, there are two factors that influence the PIOC far more than others: fuel costs and taxes. While these are facts of life for property owners everywhere, they are not immutable expenses. Fuel costs can be brought down with energy efficiencies, many of which can be paid for through NYSERDA grants and other public funds (as well as MCI rent increases). Tax abatements and exemptions are also available to landlords through the J-51 program, which paid out over a quarter billion dollars in tax credits last year.

While prices may be rising, we have to ask: what are landlords doing to keep costs low? The PIOC is a measure of prices, but it is just one factor in consideration for the Rent Guidelines Board.